Gatus vs Uptime Kuma: Why I Finally Switched (No Regrets)
Uptime Kuma worked fine, until my homelab outgrew the click-heavy workflow. I switched to Gatus for YAML-based monitoring, better infrastructure checks, easier automation, and a setup that scales with the rest of my homelab.


Uptime Kuma and I did not have some dramatic breakup.
There was no rage uninstall. No angry GitHub issue. Nobody threw a rack server through a window.
It worked.
And honestly, that was kind of the problem.
As my homelab grew, Uptime Kuma slowly went from "nice little monitoring dashboard" to "another thing I have to manually maintain." Every new service meant another monitor, another form, another set of settings, another little configuration living somewhere inside a UI that Future AJ would absolutely forget about.
My homelab had outgrown the way I was managing monitoring.
So I switched to Gatus.
And after living with it for a while?
Yeah. I'm not going back.
This is not a "Uptime Kuma sucks" article. It doesn't.
This is about why Gatus fits the way I run a larger homelab much better, how I migrated my monitoring, and why configuration-as-code ended up being a much bigger deal than I expected.

Uptime Kuma Was Fine. And That Was the Problem.
Uptime Kuma is ridiculously easy to like.
You install it, open the web UI, click Add New Monitor, point it at something, and boom: congratulations, you are now A Person Who Monitors Things.
For a smaller homelab, that experience is fantastic.
The problem is that my homelab apparently has the same relationship with scope creep that my ADHD brain has with the phrase:
"I'll just check one thing real quick."
One service becomes five.
Five becomes twenty.
Then somehow it's 2:00 AM, you've installed three more containers, reorganized the dashboard, renamed a VLAN, and you are now emotionally invested in monitoring whether RabbitMQ is listening on port 5672.
You know. Normal homelab behavior.
At the time of writing, Gatus is monitoring 77 active endpoints across the Neon Sanctum — the name I use for my home lab and smart-home infrastructure, where servers, networking gear, automations, self-hosted apps, and a frankly unnecessary amount of experimentation all live together.
That's servers, networking gear, Home Assistant, monitoring tools, databases, messaging services, productivity apps, media automation, Docker management, publishing infrastructure, and even the Epson printer that periodically remembers its true calling is open hostility.
And that's when "just add another monitor" stopped feeling quite so simple.
The issue wasn't that adding one monitor in Uptime Kuma was difficult.
It wasn't.
The issue was that every new service meant another individual configuration living inside a UI:
another monitor,
another set of conditions,
another group,
another retry policy,
another notification configuration,
another tiny decision that Future AJ would eventually have absolutely no memory of making.
Nothing was particularly painful by itself.
It was the accumulation.
Death by a thousand perfectly reasonable clicks.
Eventually I realized I wasn't really managing monitoring anymore.
I was managing a growing pile of forms.
And once the number of things I cared about crossed from "a handful" into "apparently I run a small regional data center now," I wanted something I could reason about as a whole.
Something searchable.
Something repeatable.
Something I could back up, version, generate, and review without clicking through dozens of screens.
That's where Gatus started making a lot more sense.
My Monitoring Needed Git, Not More Clicking
The biggest difference for me is simple: Gatus configuration lives in YAML.
Instead of dozens of monitor records hiding behind individual forms, the whole setup can live in one config.yaml file.
That means I can search it, review it, back it up, version it, copy patterns, generate repetitive pieces, and reorganize monitors without clicking through thirty screens.
That matters more than it sounds when ADHD memory enters the chat.
If Past AJ configured something six months ago, Present AJ may remember absolutely nothing about why. A searchable YAML file gives me one place to look instead of turning the afternoon into Monitor Settings Archaeology.
Configuration-as-code didn't just make Gatus easier to maintain. It made the monitoring setup easier to understand as a whole.
Then I Made ChatGPT Do the Boring Part 🤖
This might be my favorite part of the whole setup.
I already had most of my homelab services organized in Homepage.
Homepage knew things like:
- What the service was called.
- Which category it belonged to.
- Where it lived.
- What URL it used.
- How I mentally grouped it with the rest of the homelab.
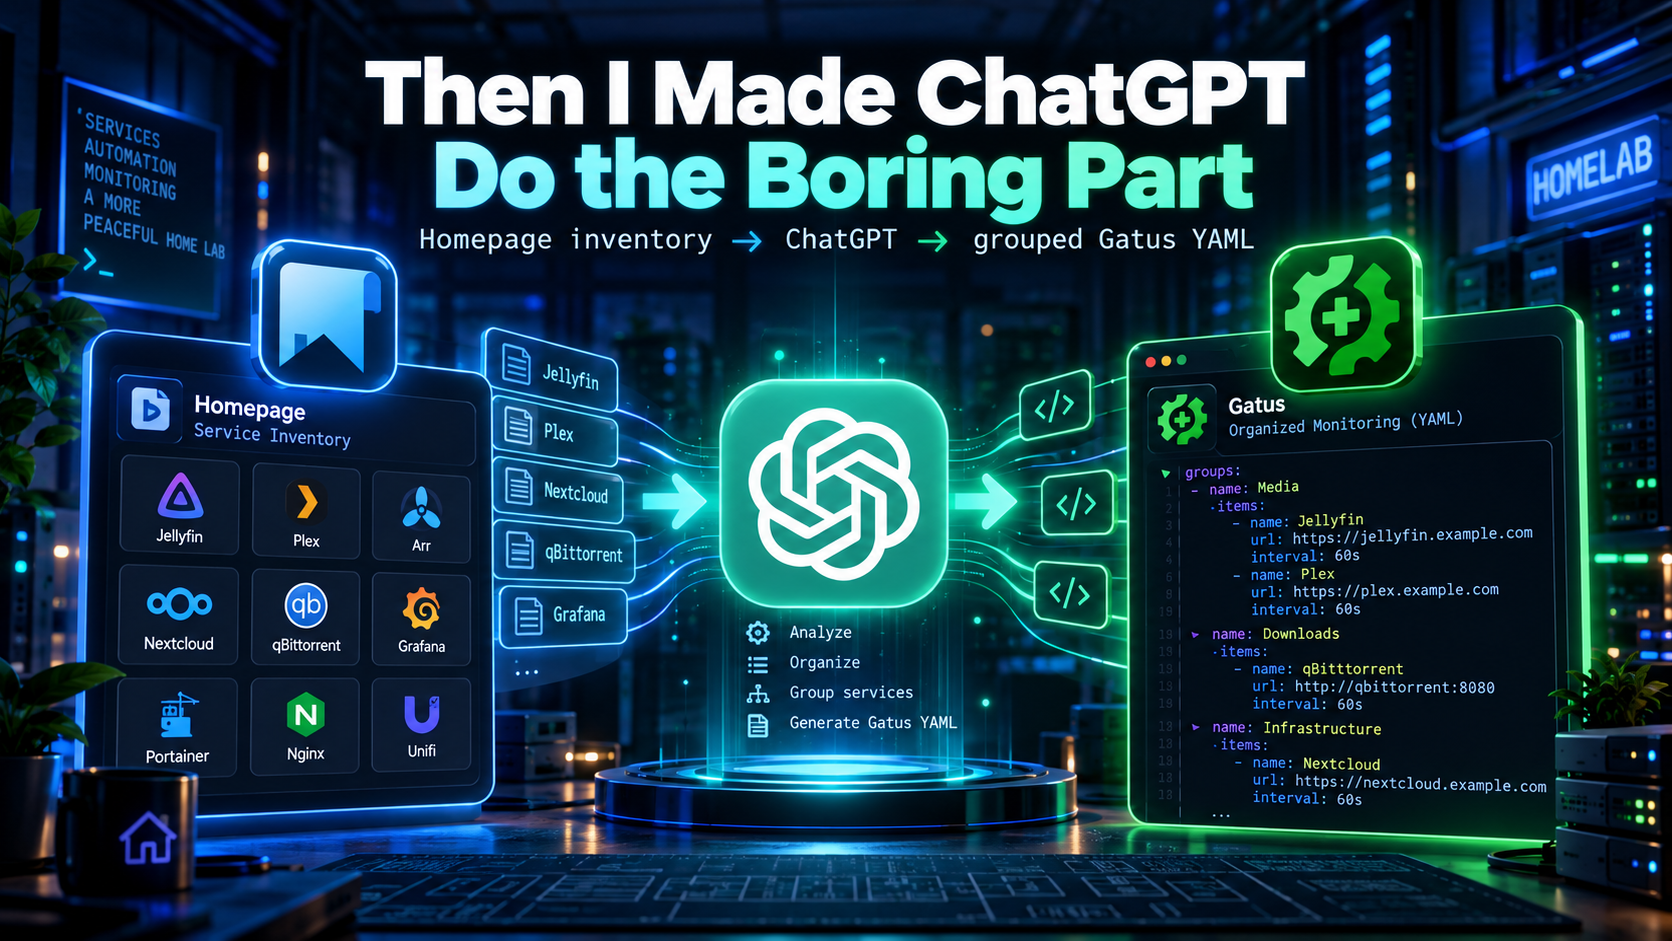
So instead of manually rebuilding that entire structure in Gatus, I used this workflow:
Homepage inventory -> ChatGPT -> grouped Gatus YAML -> review -> deploy
I gave ChatGPT the service inventory from Homepage and had it generate the repetitive Gatus endpoint definitions.
It grouped services using the same categories I already used, selected sensible monitor types, and generated alert descriptions.
That turned what could have been hours of clicking into something much closer to:
- Generate.
- Review.
- Fix anything weird.
- Deploy.
- Question why I ever considered doing all of this manually.
AI is extremely good at repetitive configuration scaffolding.
That does not mean I blindly deploy whatever it produces.
I still review:
- URLs
- Ports
- Protocols
- Conditions
- Group names
- Alert descriptions
Because having AI confidently monitor PostgreSQL on port 3306 would be a very efficient way to manufacture my own troubleshooting problem.
"Is It Up?" Is Actually Five Different Questions
"Is it up?" sounds like one question. In a homelab, it usually isn't.
Is the web app responding? Is the database port listening? Is the host reachable? Does DNS actually resolve? Is the TLS certificate about to ruin Future AJ's afternoon?
Gatus lets me answer those separately with HTTP/HTTPS, TCP, ICMP, DNS, certificate, response-code, and response-time checks.
That distinction sounds small until something breaks. Then "the server is up" becomes significantly less useful than "the server is reachable, DNS works, but PostgreSQL isn't accepting connections."
That's the kind of answer I actually want from monitoring.
Stop Monitoring Dashboards. Monitor What They Depend On.
This is where my thinking about monitoring changed the most.
Let's say I'm monitoring n8n.
The obvious monitor is:
<https://n8n.example.com>
If that goes down, I know n8n isn't reachable.
Great.
But n8n may depend on other things:
n8n HTTPS
    |
    +-- PostgreSQL
    |
    +-- RabbitMQ / Redis
    |
    +-- DNS
    |
    +-- Tailscale / reverse proxy
If PostgreSQL dies, n8n may fail.
If DNS dies, n8n may appear dead even though the container is perfectly healthy.
If the Tailscale route breaks, the application may still work locally while remote access is toast.
That context makes troubleshooting dramatically faster.
If five applications go red at the exact same time, I probably did not experience five unrelated application failures.
Something shared probably just chose violence.
Don't Duplicate Every Dependency
There is a trap here.
You do not need to attach PostgreSQL monitoring separately to every application that uses PostgreSQL.
Monitor shared infrastructure once as its own first-class endpoint.
Then your status dashboard becomes useful for correlation.
If several apps fail and PostgreSQL is also red, you've got a pretty good clue where to start.
My Monitoring Dashboard Finally Matches My Brain
I also grouped Gatus endpoints the same way I organize services elsewhere in my homelab.
My groups include things like:
- Personal
- Servers
- Docker Management
- Home Automation
- Code
- Network
- Monitoring & Analytics
- Media
- Development & Automation
- Other Infrastructure
The exact names aren't important.
Consistency is.
If Homepage says something belongs under Development & Automation, Gatus should probably say the same thing.
I don't want five different tools each inventing their own taxonomy for the same infrastructure.
That is how you end up looking at a service and thinking:
I know I installed you. Where the hell did I put you?
One mental model is easier to maintain than five.
ADHD brains already spend enough processing power remembering where things exist. My monitoring stack doesn't need to contribute to the chaos.
HTTP Monitoring: Make Sure the App Actually Answers
For web applications, a basic Gatus monitor looks something like this:
- name: Home Assistant
  group: Home Automation
  url: "<https://homeassistant.example.ts.net>"
  interval: 1m
  conditions:
    - "[STATUS] == 200"
    - "[RESPONSE_TIME] < 3000"
You can also check certificate expiration:
conditions:
  - "[STATUS] == 200"
  - "[RESPONSE_TIME] < 3000"
  - "[CERTIFICATE_EXPIRATION] > 168h"
That gives you more than "server responded."
You're checking:
- Did it respond correctly?
- Did it respond quickly enough?
- Is the certificate getting dangerously close to expiration?
One warning: don't blindly require HTTP 200 everywhere.
Some applications intentionally redirect or return another valid response.
Test the endpoint first.
Monitoring the wrong expected response is just creating an automated system for lying to yourself.
TCP Monitoring: Because Not Everything Has a Pretty Dashboard
Some of the most important services in a homelab don't have a useful HTTP endpoint.
That's where TCP checks are perfect.
PostgreSQL is a good example:
- name: PostgreSQL
  group: Databases & Messaging
  url: "tcp://postgresql01.bishop-neon.ts.net:5432"
  interval: 1m
  conditions:
    - "[CONNECTED] == true"
The same pattern works for MariaDB/MySQL on 3306, MongoDB on 27017, Valkey/Redis on 6379, RabbitMQ on 5672, MQTT on 1883, and plenty of other services that are perfectly important despite not having a shiny web page.
[CONNECTED] == true means the TCP connection succeeded. It does not prove the application authenticated successfully, executed a query, or performed higher-level business logic.
Think of it as "is anybody home?" - not "are they emotionally stable and ready to process transactions?"
Ping Is Not Application Monitoring. Stop Pretending It Is.
ICMP checks are useful when the thing you care about is the host itself.
For example:
- name: OPNsense
  group: Network
  url: "icmp://192.168.175.1"
  interval: 1m
  conditions:
    - "[CONNECTED] == true"
That's useful for:
- Routers
- Switches
- Servers
- Appliances
- Network devices
But ping should not replace application monitoring.
A server can happily answer ICMP while the application running on it is lying face-down in a ditch.
The reverse can also happen depending on firewall policy.
Use the monitor that answers the question you're actually asking.
Your DNS Dashboard Being Green Does Not Mean DNS Works
DNS deserves its own test.
If the web interface for your DNS server responds, that proves exactly one thing:
The web interface responded.
It does not prove DNS resolution is functioning.
Gatus can test that directly:
- name: Internal DNS
  group: Network
  url: "192.168.175.1"
  interval: 1m
  dns:
    query-name: "gatus.bishop-neon.ts.net"
    query-type: "A"
  conditions:
    - "[DNS_RCODE] == NOERROR"
Now you're checking the actual service instead of admiring the dashboard that controls it.
PostgreSQL FTW 🐘
Gatus can keep its history in memory, SQLite, or PostgreSQL. I use PostgreSQL because Gatus itself should be disposable without its history being disposable too.
storage:
  type: postgres
  path: "postgres://gatus:<PASSWORD>@postgresql01.bishop-neon.ts.net:5432/gatus_db?sslmode=disable"
  caching: true
That means I can restart, upgrade, or rebuild Gatus - or accidentally anger the YAML gods - without wiping the monitoring history with it.
Just don't commit the real database password to a public repo unless your weekend plans include incident response.
Alerts Without Turning My Phone Into an Air-Raid Siren
Monitoring is useless if it never tells you something broke. It's also unbearable if every hiccup arrives like the opening scene of a disaster movie.
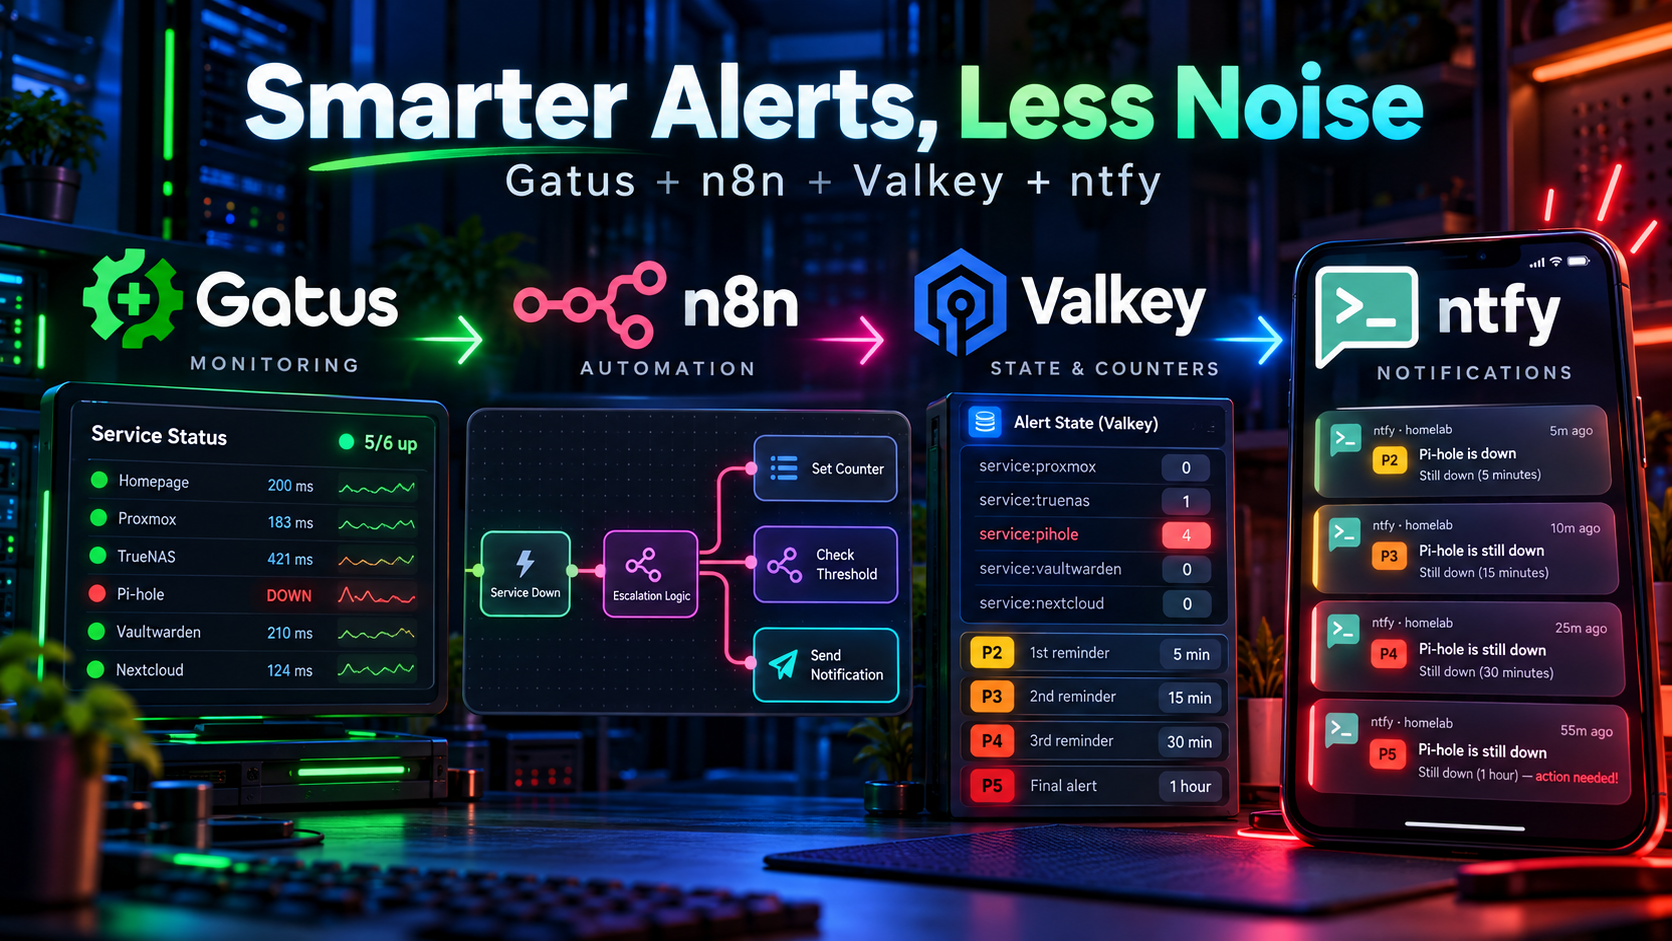
My alert path is:
Gatus → n8n → Valkey → ntfy
Gatus decides when an endpoint has actually failed. n8n handles the alert logic and formatting. Valkey remembers how many reminders have been sent for the same active outage. ntfy gets the privilege of interrupting me.
A typical endpoint alert looks like this:
alerts:
  - type: n8n
    failure-threshold: 10
    success-threshold: 2
    send-on-resolved: true
    minimum-reminder-interval: 30m
    description: "Epson WF-7840 is down — the printer has resumed its natural state: hostile"
The Longer It's Broken, the Louder It Gets
I assign a base ntfy priority based on the type of service. Critical infrastructure - servers, networking, databases, and security - can start urgent. Less important devices start quieter.
Then Valkey keeps a tiny counter for each active outage and n8n raises the priority as reminders accumulate.
Initial outage       → priority 2
30-minute reminder   → priority 2
60-minute reminder   → priority 3
90-minute reminder   → priority 4
120-minute reminder  → priority 5
So the printer being offline for five minutes is background noise. The printer being offline for two hours means diplomacy has failed.
Critical services don't have to earn urgency. If PostgreSQL or OPNsense disappears, n8n can start at priority 5 immediately. Escalation only raises priority; it never downgrades something that already matters.
Valkey Remembers Until Gatus Says We're Good
For each active outage, n8n keeps a lightweight Valkey key such as:
gatus:outage:devices:epson-wf-7840:notifications
Each unresolved reminder increments it. A TTL protects against stale state, and when Gatus sends a resolved event, n8n deletes the key and sends a normal-priority recovery notification.
Because a priority-5 emergency alert telling me that everything is fine would be very monitoring-software behavior, but not especially useful.
Make The Notification Useful Before You Open The Dashboard
The endpoint name is already in the notification, so Endpoint failed. tells me essentially nothing.
I give each service a short description that is recognizable on its own:
description: "LinkStack is down - the links have unstacked themselves"
Or:
description: "Gatus is down - monitoring has apparently become performance art"
It's partly personality, but it's practical too. If monitoring is going to derail my train of thought, the notification should at least tell me what happened without making me open another dashboard.
Local Works. Tailscale Doesn't. Cool. Which Thing Broke?
For a few critical services, I monitor both the local and remote access paths.
For example:
<http://192.168.x.x>:port
tells me:
Is the application alive on my LAN?
While:
<https://service.example.ts.net>
can answer:
Can I reach it through the Tailscale/proxy path?
Those are two different failures.
If LAN is green and Tailscale is red, I probably don't need to waste time restarting the application.
That's extremely useful for administrative services where losing remote access would make fixing the problem much more annoying.
I don't do this for every tiny service.
Monitoring every conceivable path for everything is how a clean dashboard mutates into the cockpit of a Boeing 747.
Before You Blame Gatus, SSH Into the Damn Server
If Gatus says something is down, test it from the Gatus host - not your laptop, phone, or the machine three VLANs away with a completely different route.
curl -vk <https://HOST>:PORT/
nc -vz HOST PORT
ping HOST
ip route get TARGET_IP
dig @DNS_SERVER hostname.example
If those fail from the Gatus host, Gatus probably isn't being dramatic. It's reporting reality.
Congratulations. You've discovered networking. 🫠
YAML: Because Apparently Spaces Can Commit Treason
Configuration-as-code is fantastic right until one space starts a coup.
If Gatus refuses to start after a change, I check journalctl -u gatus, YAML indentation, quoted condition strings, protocol prefixes, alert-provider names, and whether the destination actually works from the Gatus host.
systemctl restart gatus
journalctl -u gatus -n 100 --no-pager
Most mistakes show themselves pretty quickly.
Including the inevitable:
Why is this broken?
Oh. That space.
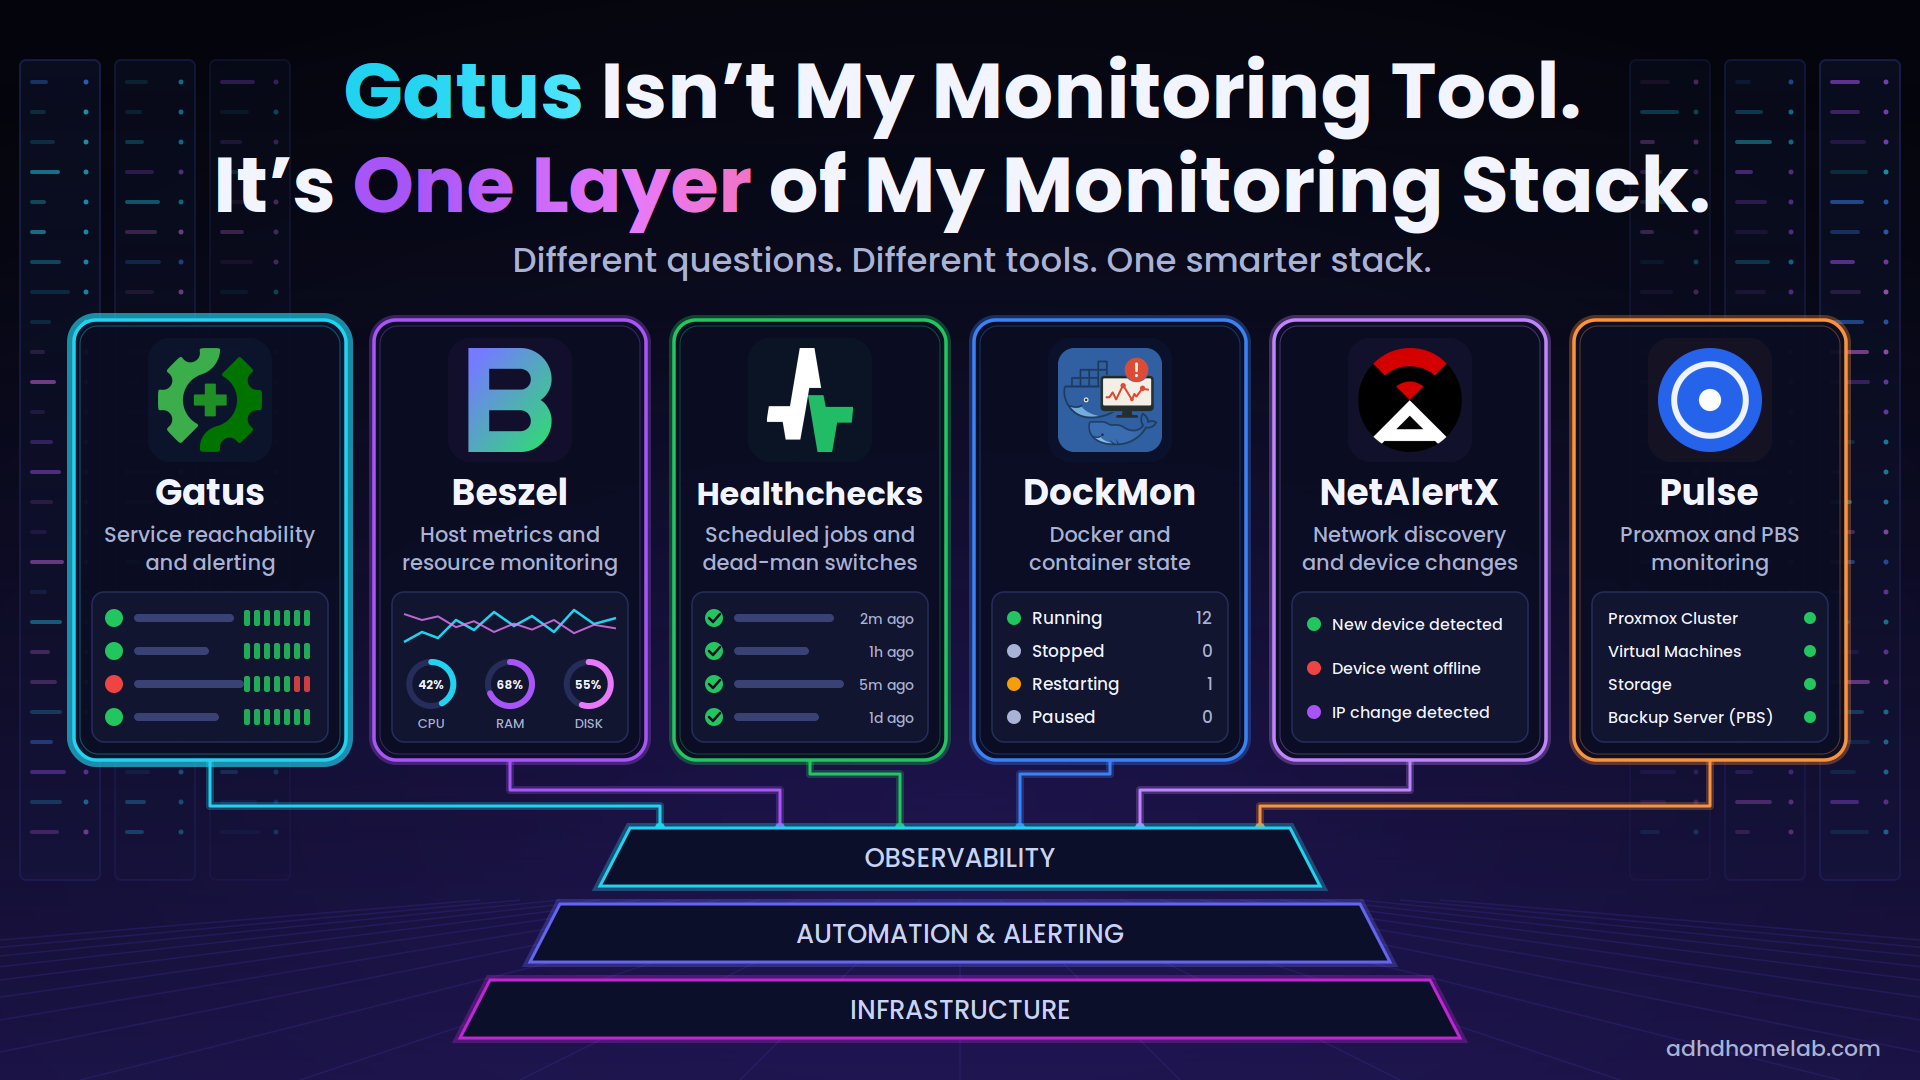
Gatus Isn't My Monitoring Tool. It's One Layer of My Monitoring Stack.
One of the more useful realizations I've had is that I don't actually want one giant monitoring application.
I want several focused tools that answer different questions well.
My stack looks more like this:
Gatus tells me whether the service is actually reachable and responding the way I expect.
Beszel tells me whether the host is running hot, chewing through RAM, or otherwise preparing to become tomorrow's problem.
I also use Pulse specifically for Proxmox and Proxmox Backup Server monitoring, where it gives me a cleaner at-a-glance view of cluster health, guests, storage, and backup infrastructure than I want Gatus handling.
Healthchecks tells me whether the scheduled job actually ran instead of quietly ghosting me.
DockMon tells me whether Docker is behaving, restarting containers, or has decided that uptime is more of a suggestion than a goal.
NetAlertX tells me what just appeared, disappeared, or changed on the network before I have to start wondering whether that mystery device was always there.
Different questions. Different tools. And honestly, I prefer it that way. I'd rather have a few focused tools that each answer one question well than one giant monitoring platform trying to be the Avengers of observability.
I stopped looking for One Monitoring App to Rule Them All.
That's how you end up with software that technically does everything and somehow answers nothing.
Uptime Kuma to Gatus: How the Migration Actually Maps
The migration itself isn't difficult once you stop thinking in terms of individual UI settings and start thinking about the purpose of each monitor.
My rough translation looked like this:
Uptime Kuma HTTP monitor
        ->
Gatus HTTPS endpoint + STATUS condition

Uptime Kuma TCP monitor
        ->
Gatus tcp:// endpoint + CONNECTED condition

Uptime Kuma Ping monitor
        ->
Gatus icmp:// endpoint + CONNECTED condition

Uptime Kuma DNS monitor
        ->
Gatus DNS configuration + DNS_RCODE condition

Retries / recovery alerts
        ->
failure-threshold / success-threshold / send-on-resolved

Monitor groups
        ->
Gatus group property
The big improvement isn't that Gatus has some magical new type of monitor.
It's that the final inventory lives in one reviewable configuration instead of being scattered across individually configured UI records.
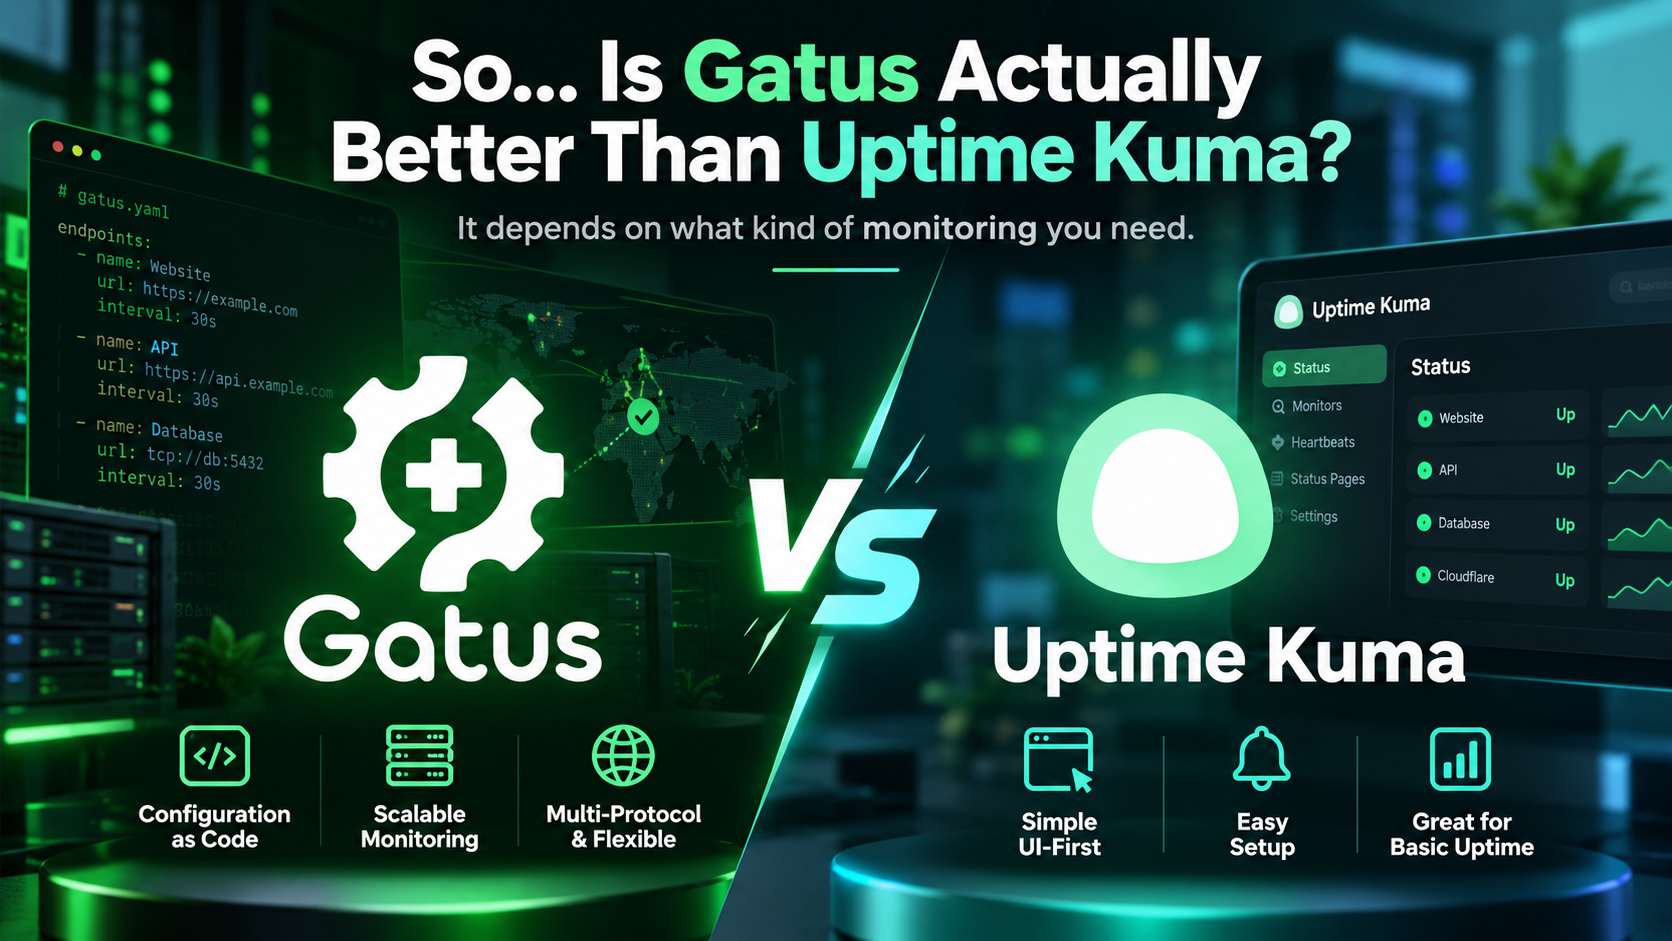
So... Is Gatus Actually Better Than Uptime Kuma?
Not universally.
And I think that's important.
Uptime Kuma Is Probably Better If...
You want:
- An easy UI-first experience.
- Fast setup.
- A relatively small monitor inventory.
- Minimal YAML.
- Something approachable for people who don't want configuration-as-code.
Uptime Kuma is excellent at that.
I would still recommend it.
Gatus Is Probably Better If...
You want:
- Monitoring configuration in YAML.
- Something easy to review and back up.
- Consistent monitor patterns.
- Bulk configuration changes.
- HTTP, TCP, DNS, ICMP, and certificate checks.
- AI-assisted configuration generation.
- Monitoring that grows alongside a larger homelab.
- Your service inventory to behave more like infrastructure-as-code.
That's where I landed.
The Best Part Isn't Actually Gatus
The unexpected win wasn't the dashboard. It was the workflow around it.
Homepage became the human-readable inventory. ChatGPT became the translator. Gatus became the machine-readable monitoring layer.
That makes Homepage more than a pretty launcher; it becomes source material for monitoring-as-code whenever the homelab changes.
And that is the part that finally made monitoring feel like it belongs with the rest of my infrastructure.
No Regrets
Uptime Kuma didn't fail me. I just outgrew the way I was using it.
Gatus fits the Neon Sanctum better because the monitoring is now something I can version, automate, regenerate, and actually understand later.
For my homelab, that was enough to make the switch permanent.
No regrets.
What Are You Using?
I'm curious what the rest of the homelab universe is using for service monitoring.
Are you running Gatus, Uptime Kuma, something else entirely, or some delightfully over-engineered monitoring stack held together with YAML, webhooks, and questionable late-night decisions?
Drop a comment below and let me know:
- What are you using for uptime and service monitoring?
- Have you tried both Gatus and Uptime Kuma?
- What made you stick with one over the other?
- Is there something your current setup does that you think I'm missing?
I'm especially interested in hearing from anyone who made the switch in either direction.
Because if there's one thing homelabbers are good at, it's having very strong opinions about monitoring software. 😅
Thanks for reading,
AJ
Discussion